
The math: two names for one measurement
Start with the same $100 of attributed ad sales bought with $25 of spend:
- ACoS (Advertising Cost of Sales) = 25 ÷ 100 = 25%. The share of ad revenue that advertising consumed. Lower is leaner.
- ROAS (Return on Ad Spend) = 100 ÷ 25 = 4.0×. Revenue produced per advertising dollar. Higher is leaner.
Because each is the reciprocal of the other, converting is one division: ROAS = 1 ÷ ACoS, and ACoS = 1 ÷ ROAS. There is no information in one that isn't in the other — arguing about which metric to "use" is arguing about units, like feet versus metres.
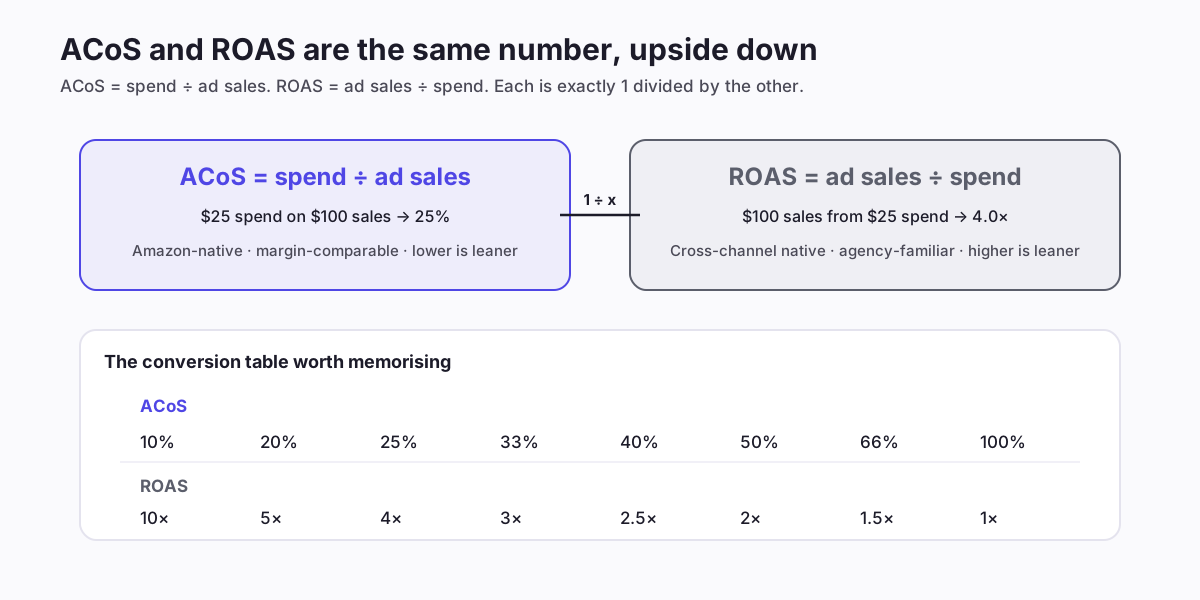
The table's two ends teach the intuition fastest: 100% ACoS = 1× ROAS means every sales dollar cost a spend dollar (you bought revenue, not profit), and 10% ACoS = 10× ROAS is the rarefied territory of dominant listings on branded terms.
Where the two cultures come from
The split is historical, not technical. Amazon's console grew up reporting ACoS, so the seller ecosystem — reports, tools, forum advice — speaks it natively. Broader digital marketing grew up on ROAS, because when you buy ads across Google, Meta and retail networks, "return per dollar" is the only unit that travels. Agencies and finance teams therefore default to ROAS; Amazon-native sellers default to ACoS; and both occasionally act as if the other side is measuring something different. They aren't — but the defaults each culture attaches differ, and that's where real confusion starts: a marketing hire's "we target 4× ROAS" and a seller's "we target 25% ACoS" are the identical policy wearing different clothes. Recognising that dissolves half the arguments; the other half are really about the next section.
One habit worth adopting whichever culture you come from: state the unit every time a target is written down. "Target: 27%" in a shared document will eventually be read as a ROAS by someone, and a 27× ROAS target is a 3.7% ACoS — an instruction to strangle the account. The three characters "ACoS" or the one character "×" cost nothing and have prevented more real budget accidents than most optimisation techniques ever will.
Which metric for which job
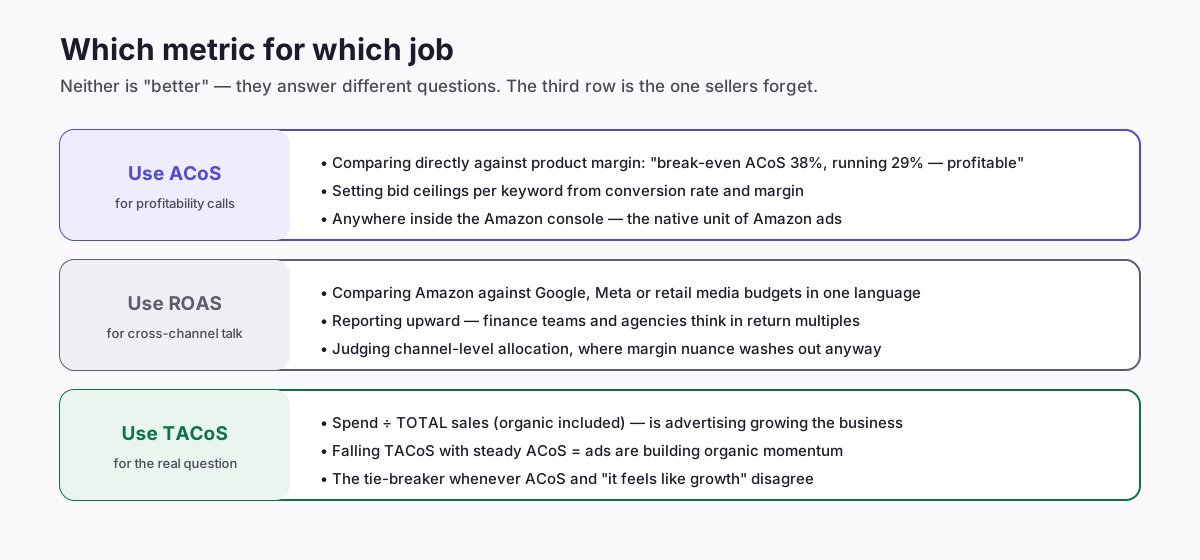
ACoS wins for profitability decisions because it lives on the same scale as margin. Your break-even is "margin as a share of price" — a percentage — so "break-even 38%, running 29%" reads instantly. The ROAS version ("break-even 2.63×, running 3.45×") is the same fact through a fish-eye lens: the reciprocal makes differences near breakeven visually tiny and differences at low spend look dramatic.
ROAS wins for cross-channel work for the mirror reason: margin math is channel-specific, but "this channel returns 3.1×, that one 4.2×" compares budgets in one breath. If you report to anyone who also buys Google or Meta ads, translate — fluently, via the table above.
Neither answers "are ads growing my business?" Both only see attributed sales. An account can post a beautiful 20% ACoS by spending entirely on its own brand keywords — harvesting sales that would mostly have happened organically. Efficient-looking, growth-free.
TACoS: the tie-breaker both metrics need
TACoS (Total ACoS) divides ad spend by total sales — organic included. That one change makes it the health metric the other two can't be:
- TACoS falling while ACoS holds steady: the flywheel is working — advertising is feeding sales velocity, velocity is feeding organic rank, and a growing share of revenue no longer needs paying for. This is what "ads as an investment" looks like in numbers.
- TACoS flat while ACoS improves: efficiency gains are real but organic isn't compounding — common when spend concentrates on brand terms or when the listing can't convert its organic visitors.
- TACoS rising while ACoS looks fine: the warning shape — ads are progressively replacing organic sales rather than adding to them. Often the first visible symptom of cannibalisation or of organic rank decaying underneath steady ad performance.
A practical review order: ACoS per product against break-even (profitability), then TACoS trend per product (trajectory). Five minutes, and it catches the failure mode each metric is blind to alone.
Common traps with both metrics
Four ways these numbers lie to careful people:
- The attribution window. Amazon credits orders to clicks for days afterward, so recent ACoS always reads worse — and ROAS correspondingly lower — than it will settle once the sales land. Judge on windows that exclude the last 2-3 days — the diagnosis guide shows how often "sudden ACoS spikes" are just this.
- Averaging across products. Account-level ACoS blends a 60%-margin winner with a 15%-margin struggler into a number meaningful for neither. Efficiency metrics are per-product tools; use account level only for trend.
- Event-week readings. During deal events, CPCs, conversion rates and attribution lag all move at once. Compare event weeks to event weeks, never to the Tuesday before.
- Optimising the ratio instead of the profit. The account with the best possible ACoS is one tiny campaign on your brand name. Ratios are constraints, not objectives — the objective is total profitable sales, which is why the lower-ACoS playbook spends half its time protecting sales while efficiency improves.
Setting targets in either language
The target-setting logic is identical in both units; here it is once, in both:
- Compute break-even: margin after product cost and Amazon fees, as a share of price. Say 40% → break-even ROAS 2.5×.
- Choose the profit you want per advertised order: keeping a third of margin as profit puts target ACoS ≈ 27% (target ROAS ≈ 3.7×).
- Allow strategic exceptions with end dates: launches deliberately run above break-even to buy rank; their "target" is a date and a rank, not a ratio — and their success metric is the TACoS trend after, not the ACoS during.
- Re-derive quarterly: fee changes, price moves and deal seasons all shift break-even. A target set in January quietly becomes fiction by Q4 — where deal prices can nearly halve it.
Whichever unit you think in, write targets down per product. The metric wars end quickly when everyone can see the same break-even line.
Worked example: one product, all three metrics, one quarter
To see the metrics divide their labour, follow one composite product through a quarter. A $30 kitchen item, $12 margin after costs and fees → break-even ACoS 40% (ROAS 2.5×). The seller targets 27% ACoS (3.7×).
Month 1: ACoS 33%, TACoS 14%. Profitable per order (33 < 40) but off target. The ACoS lens drives the work: a waste-then-bids pass begins. ROAS tells the same story as 3.0× — nobody needs it yet.
Month 2: ACoS 27%, TACoS 13.5%. Target hit — and here TACoS earns its seat: it barely moved while ACoS improved six points, meaning the gains were true efficiency (cheaper attributed sales), not organic growth. Fine, but watch it.
Month 3: ACoS 26%, TACoS 11%. Now the good shape: ACoS steady, TACoS falling — organic sales growing under the ads. The flywheel the seller was buying all along is finally visible, and it was only visible in TACoS; ACoS and ROAS were flat and happy for two straight months.
Meanwhile the agency running the seller's Google ads asks for "the Amazon ROAS" — 3.85× — for the cross-channel deck, and gets it via one division. That's the entire division of labour in one quarter: ACoS worked the account, TACoS judged the strategy, ROAS talked to the outside world.
How AIAdKing uses all three
Inside AIAdKing's nightly cycle the three metrics do exactly the jobs above: bids derive from per-target conversion evidence against ACoS-vs-break-even arithmetic, account and product dashboards trend TACoS so brand-term harvesting can't masquerade as growth, and reports translate to ROAS wherever cross-channel eyes will read them. Every resulting change is logged with its reasoning and previewable in shadow mode — so the metrics stay decision inputs rather than decoration. Flat fee, details here.